Major geopolitical events, like the "Liberation Day" tariffs declared on April 2nd, 2025, send immediate tremors through financial markets. The initial chaos might already feel like ancient history (writing this April 27th), but studying the market's raw reaction in those first days reveals underlying economic structures often hidden in calmer times. These disruptive moments are valuable opportunities for market analysis.
Why Market Shocks Are Revealing
The stock market reflects collective investor expectations. Investors use various tools, including factor models, to understand what drives stock returns. These models break down performance into different components – like the overall market trend, company size, or investment style (like value vs. growth). These factors usually explain a good deal of market activity.
But when a major shock hits - a pandemic, a financial crisis, unforeseen tariffs – things change. The event itself can temporarily dwarf the influence of standard factors, explaining a large part of the market's variance. This isn't random noise, but concentrated information. Intense market reactions can highlight hidden information, such as supply chain weaknesses or the degree of global interdependence, that are harder to perceive normally. This is precisely why focused, event-driven analysis becomes crucial.
Building the "Tariff Factor: The Importance of the Window
To isolate the impact of the "Liberation Day" tariffs, our economist Lemin Wu constructed a specific "Tariff Factor." The basic idea is to capture the impact of the tariff news by comparing the most and least affected stocks.
Create the Tariff Factor: Stocks were ranked based on their residual return - after accounting for the general market factor. The Tariff Factor was defined as the residual return difference: average return of bottom 25% performers - average return of top 25% performers during the "event window". This factor essentially measures the performance gap between most vulnerable (bottom 25%) and least vulnerable (top 25%) stocks based on the market's immediate reaction.
Calculating Individual Stock Price Exposure: Next we need to understand how exposed each individual stock was to this factor. We ran a multivariate regression on each stock's historical daily returns prior to April 2nd against both the standard Market Factor and our custom Tariff Factor. Note that we used price prior to the event so that we can reveal the stock's pre-existing or inherent sensitivity to the economic pressures revealed by the tariffs.
A crucial choice is defining that "event window." How long after the shock should we measure the reaction? Lemin compared two approaches: using just the first day of market reaction (April 3rd) versus using the first four trading days (April 3-8).
The results were telling. As the graph below shows, the factor built using only the single day (April 3rd) reacted logically to subsequent news – it showed a clear rebound on April 9th when the partial 90-day tariff pause was announced. In contrast, the factor built using the 4-day window remained flat on April 9th, failing to capture the rebound.
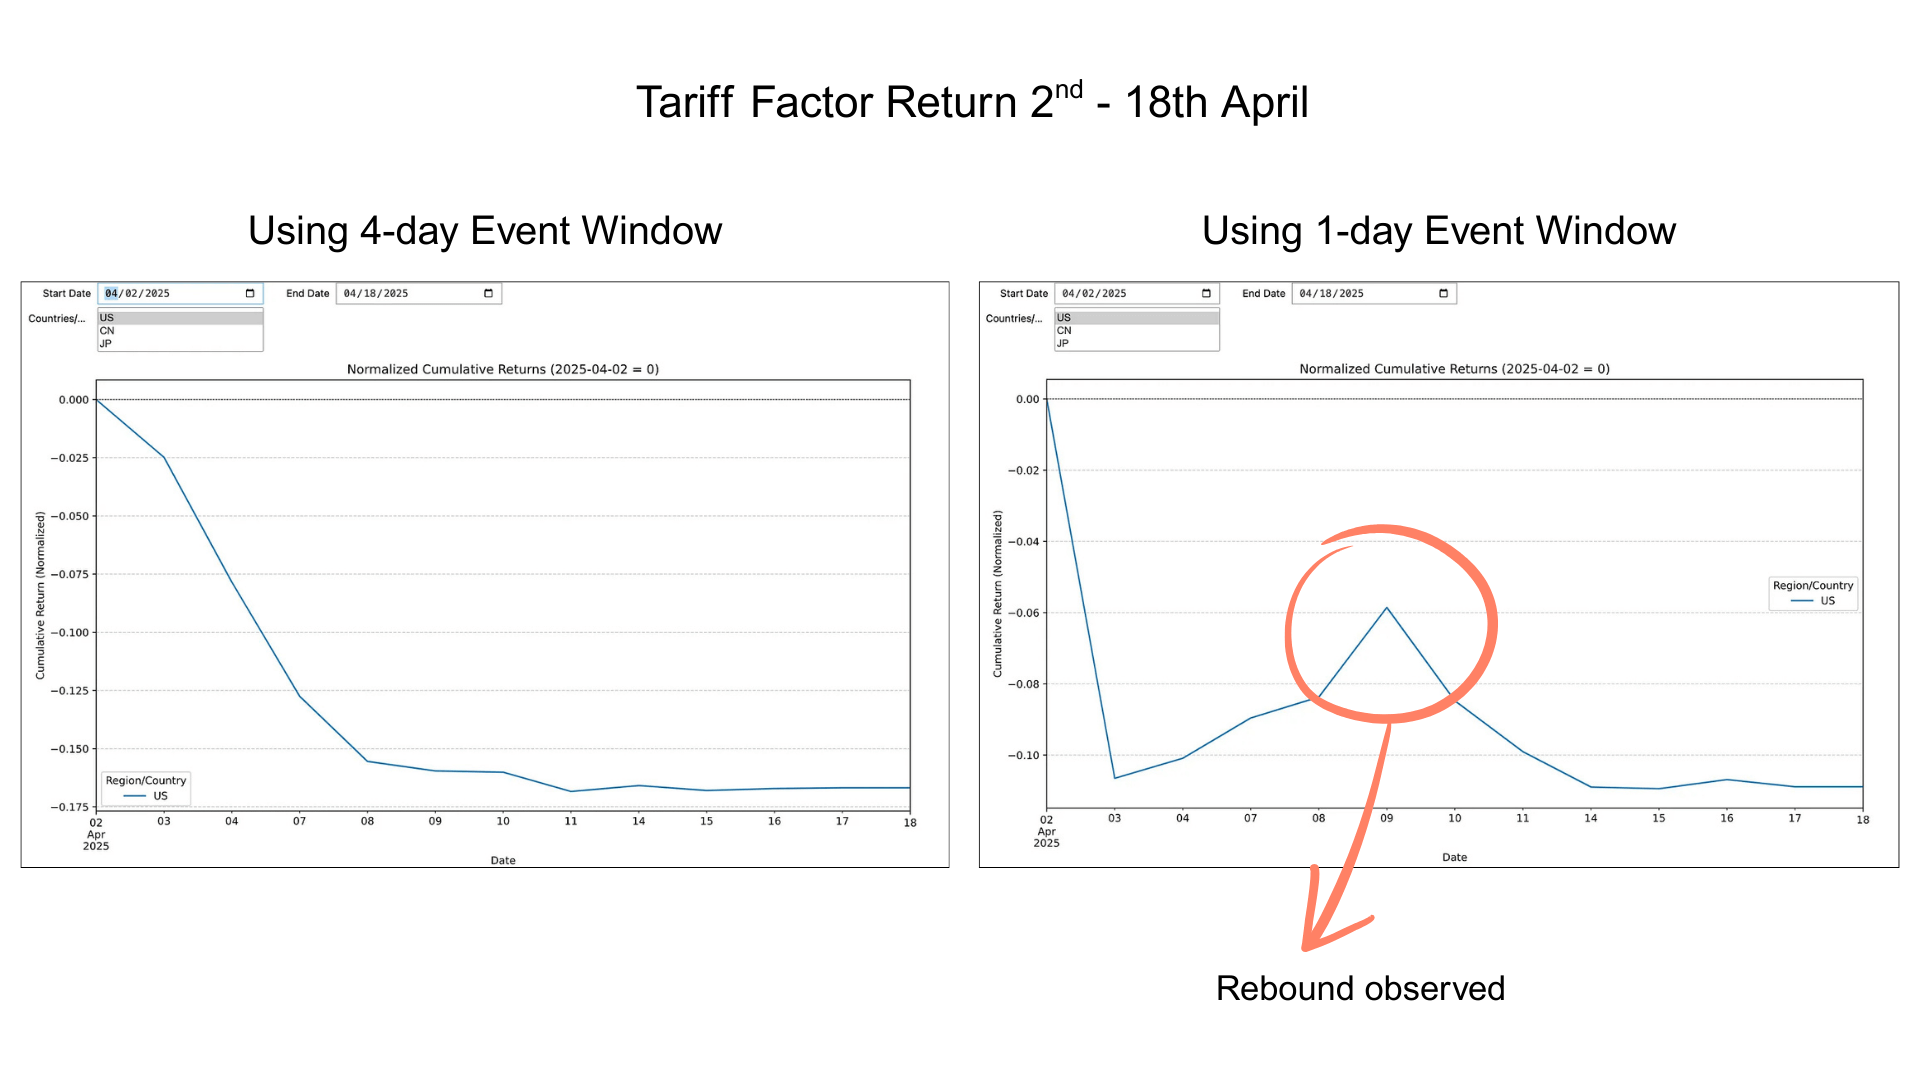
This comparison suggests that markets react extremely quickly to major news. In this case, the cleaner signal of the tariff's impact was captured by focusing tightly on the initial shock. Extending the window risked incorporating subsequent noise and corrections, obscuring the factor's behaviour. (For a detailed dive into the impact window analysis, see Lemin's research post on event window here).
What Did the Market Signal? Thematic Insights from the Shock
We studied the performance of different theme using data from the 1-day Tariff Factor and Theia Insights Industry Classification system, and interesting patterns emerged:
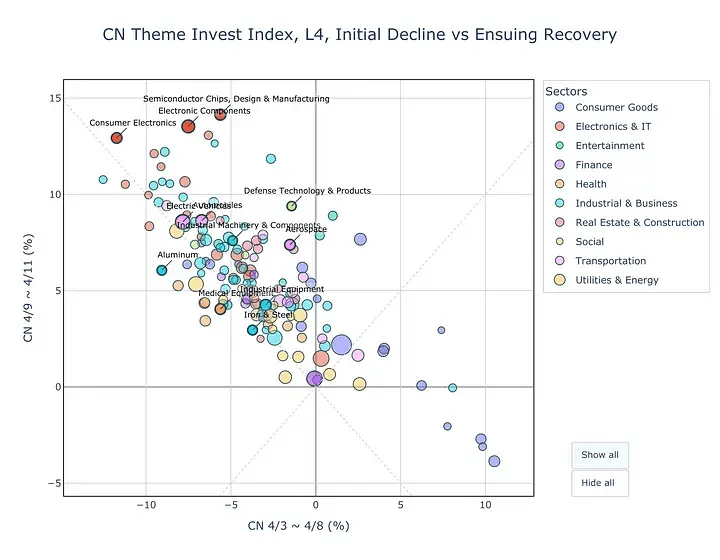
- China: Strong Semiconductor Rebound. Lemin's analysis highlighted a striking divergence in China. While many sectors initially fell, Chinese Semiconductor, Electronic Components and Consumer Electronics themes experienced a remarkable rebound shortly after the initial shock. This coincided with potential policy shifts within China (regarding chip 'country of origin' rules) that seemed designed to shield domestic producers from the new tariffs. The graph below, showing that themes such as Semiconductor and Consumer Electronics experienced initial drop (x-axis) followed by strong rebound (y-axis).
Japan: Similar Sensitivities? Our broader thematic analysis suggests Japanese markets showed related dynamics. Themes tied to technology, export-oriented manufacturing, and finance appeared sensitive to the tariff shock dynamic. Conversely, themes focused on domestic services (like tourism, hospitality, real estate) seemed to act counter to the main shockwave, perhaps reflecting some insulation from the direct trade conflict but vulnerability to overall economic sentiment.
United States: A Murkier Picture One of the key justifications for the tariffs was to boost US manufacturing. However, Lemin's analysis of 12 key "manufacturing reshoring" themes (like Steel, Autos, Semis, Aerospace) found little evidence that the market believed these specific sectors would benefit, at least initially. These themes dropped along with the rest of the market and didn't show systematically smaller declines. Why the skepticism? Unlike the specific conditions potentially aiding Chinese chipmakers, US manufacturers in these key sectors are often heavily reliant on global supply chains and international sales. The market seemed to weigh the harm from disrupted supply chains and potential retaliatory tariffs more heavily than any potential benefit from protectionism.
For more insights on how the Tariff Factor impacted different themes and countries, see Lemin's post here.
The Takeaway: Signal Through the Noise
Major events can reveal hidden economic structures that are hidden in quiet times, but analysing market reactions to shocks requires careful methodology. As this case study shows, even choosing the right time window (one day vs. four days) is crucial for capturing a clear signal.
The "Liberation Day" tariff event provides a powerful example of these dynamics. By combining the custom Tariff Factor with Theia Insights' dynamic and granular industry classification, we can move beyond broad market reactions and see how the shock rippled differently across specific economic themes and countries. This approach revealed meaningful patterns, such as the stark contrast between the apparent resilience in China's semiconductor sector versus the skepticism around US manufacturing themes. Combining a dedicated factor and theme + country analysis, we can see the specific winners, losers, and hidden economic risks during a market shock.
Get in Touch
press@theiainsights.comAbout Theia Insights
Theia Insights is a deeptech company building the common ontology for global financial markets. Founded in Cambridge, Theia combines proprietary AI, natural language processing, quantitative modelling and knowledge graph architecture to translate diverse sources of corporate and financial signals into a living map of the economy.
Used by leading index providers, asset managers, hedge funds, banks and fintech platforms, Theia's structural intelligence layer enables consistent, auditable and economically grounded decision-making across teams, systems and increasingly, AI workflows.
Named after the Greek goddess of sight, Theia reflects its mission: to make visible the underlying structure of the global economy.